Mastering Mobile Development with Chrome DevTools: A Comprehensive Guide
In today’s mobile-first world, ensuring your website and web applications perform flawlessly on mobile devices is paramount. Chrome DevTools provides a powerful suite of mobile dev tools that can significantly streamline the development and debugging process. This comprehensive guide will delve into the various features and functionalities of Chrome DevTools for mobile development, equipping you with the knowledge and skills to create exceptional mobile experiences.
Understanding the Importance of Mobile-First Development
Before diving into the specifics of Chrome DevTools, it’s crucial to understand why mobile-first development is so important. With the majority of internet traffic now originating from mobile devices, optimizing your website for mobile is no longer optional; it’s essential for success. A mobile-friendly website not only provides a better user experience but also improves your search engine ranking.
Mobile-first development involves designing and developing your website or web application specifically for mobile devices, and then progressively enhancing it for larger screens. This approach ensures that your website is fast, responsive, and easy to use on mobile devices, which can lead to increased engagement, conversions, and customer satisfaction.
Getting Started with Chrome DevTools
Chrome DevTools is a set of web developer tools built directly into the Google Chrome browser. To access DevTools, simply right-click on any web page and select “Inspect” or use the keyboard shortcut Ctrl+Shift+I (Windows/Linux) or Cmd+Option+I (macOS). The DevTools window will open, providing access to a wide range of tools for inspecting and debugging your website.
Device Mode and Mobile Emulation
One of the most valuable features of Chrome DevTools for mobile dev tools is Device Mode, which allows you to emulate various mobile devices directly within your browser. To enable Device Mode, click the “Toggle device toolbar” icon in the top-left corner of the DevTools window. This will transform the viewport into a simulated mobile device screen.
Device Mode allows you to:
- Select a specific device: Choose from a list of pre-configured devices, such as iPhones, iPads, and Android devices, or add your own custom device profiles.
- Adjust screen size and resolution: Manually resize the viewport to test your website on different screen sizes and resolutions.
- Simulate network conditions: Throttle your network speed to simulate slow mobile connections and test how your website performs under different network conditions. This is crucial for understanding the user experience on slower networks.
- Simulate device orientation: Rotate the viewport to test your website in both portrait and landscape modes.
- Emulate touch events: Interact with your website using touch events, as if you were using a real mobile device.
Inspecting and Debugging Mobile Layouts
Chrome DevTools provides powerful tools for inspecting and debugging mobile layouts. The Elements panel allows you to examine the HTML and CSS of your website, making it easy to identify and fix layout issues.
Key features for inspecting mobile layouts include:
- Element selection: Use the “Select an element in the page to inspect it” icon to quickly select and inspect any element on the page.
- CSS inspection: View and modify the CSS styles applied to an element, allowing you to experiment with different styles and see the results in real-time.
- Computed styles: View the computed styles of an element, which shows the final styles that are applied after all CSS rules have been applied.
- Box model: Visualize the box model of an element, which shows the margin, border, padding, and content areas of the element.
Debugging JavaScript on Mobile
Debugging JavaScript code on mobile devices can be challenging, but Chrome DevTools provides powerful tools to simplify the process. The Sources panel allows you to set breakpoints, step through your code, and inspect variables.
Key features for debugging JavaScript on mobile include:
- Setting breakpoints: Set breakpoints in your code to pause execution at specific lines.
- Stepping through code: Step through your code line by line to see how it executes.
- Inspecting variables: Inspect the values of variables at any point in your code.
- Console logging: Use the `console.log()` function to log messages to the console, which can be helpful for debugging and tracking down errors.
Performance Profiling for Mobile
Performance is critical for mobile websites and web applications. Chrome DevTools provides powerful tools for profiling your website’s performance and identifying bottlenecks.
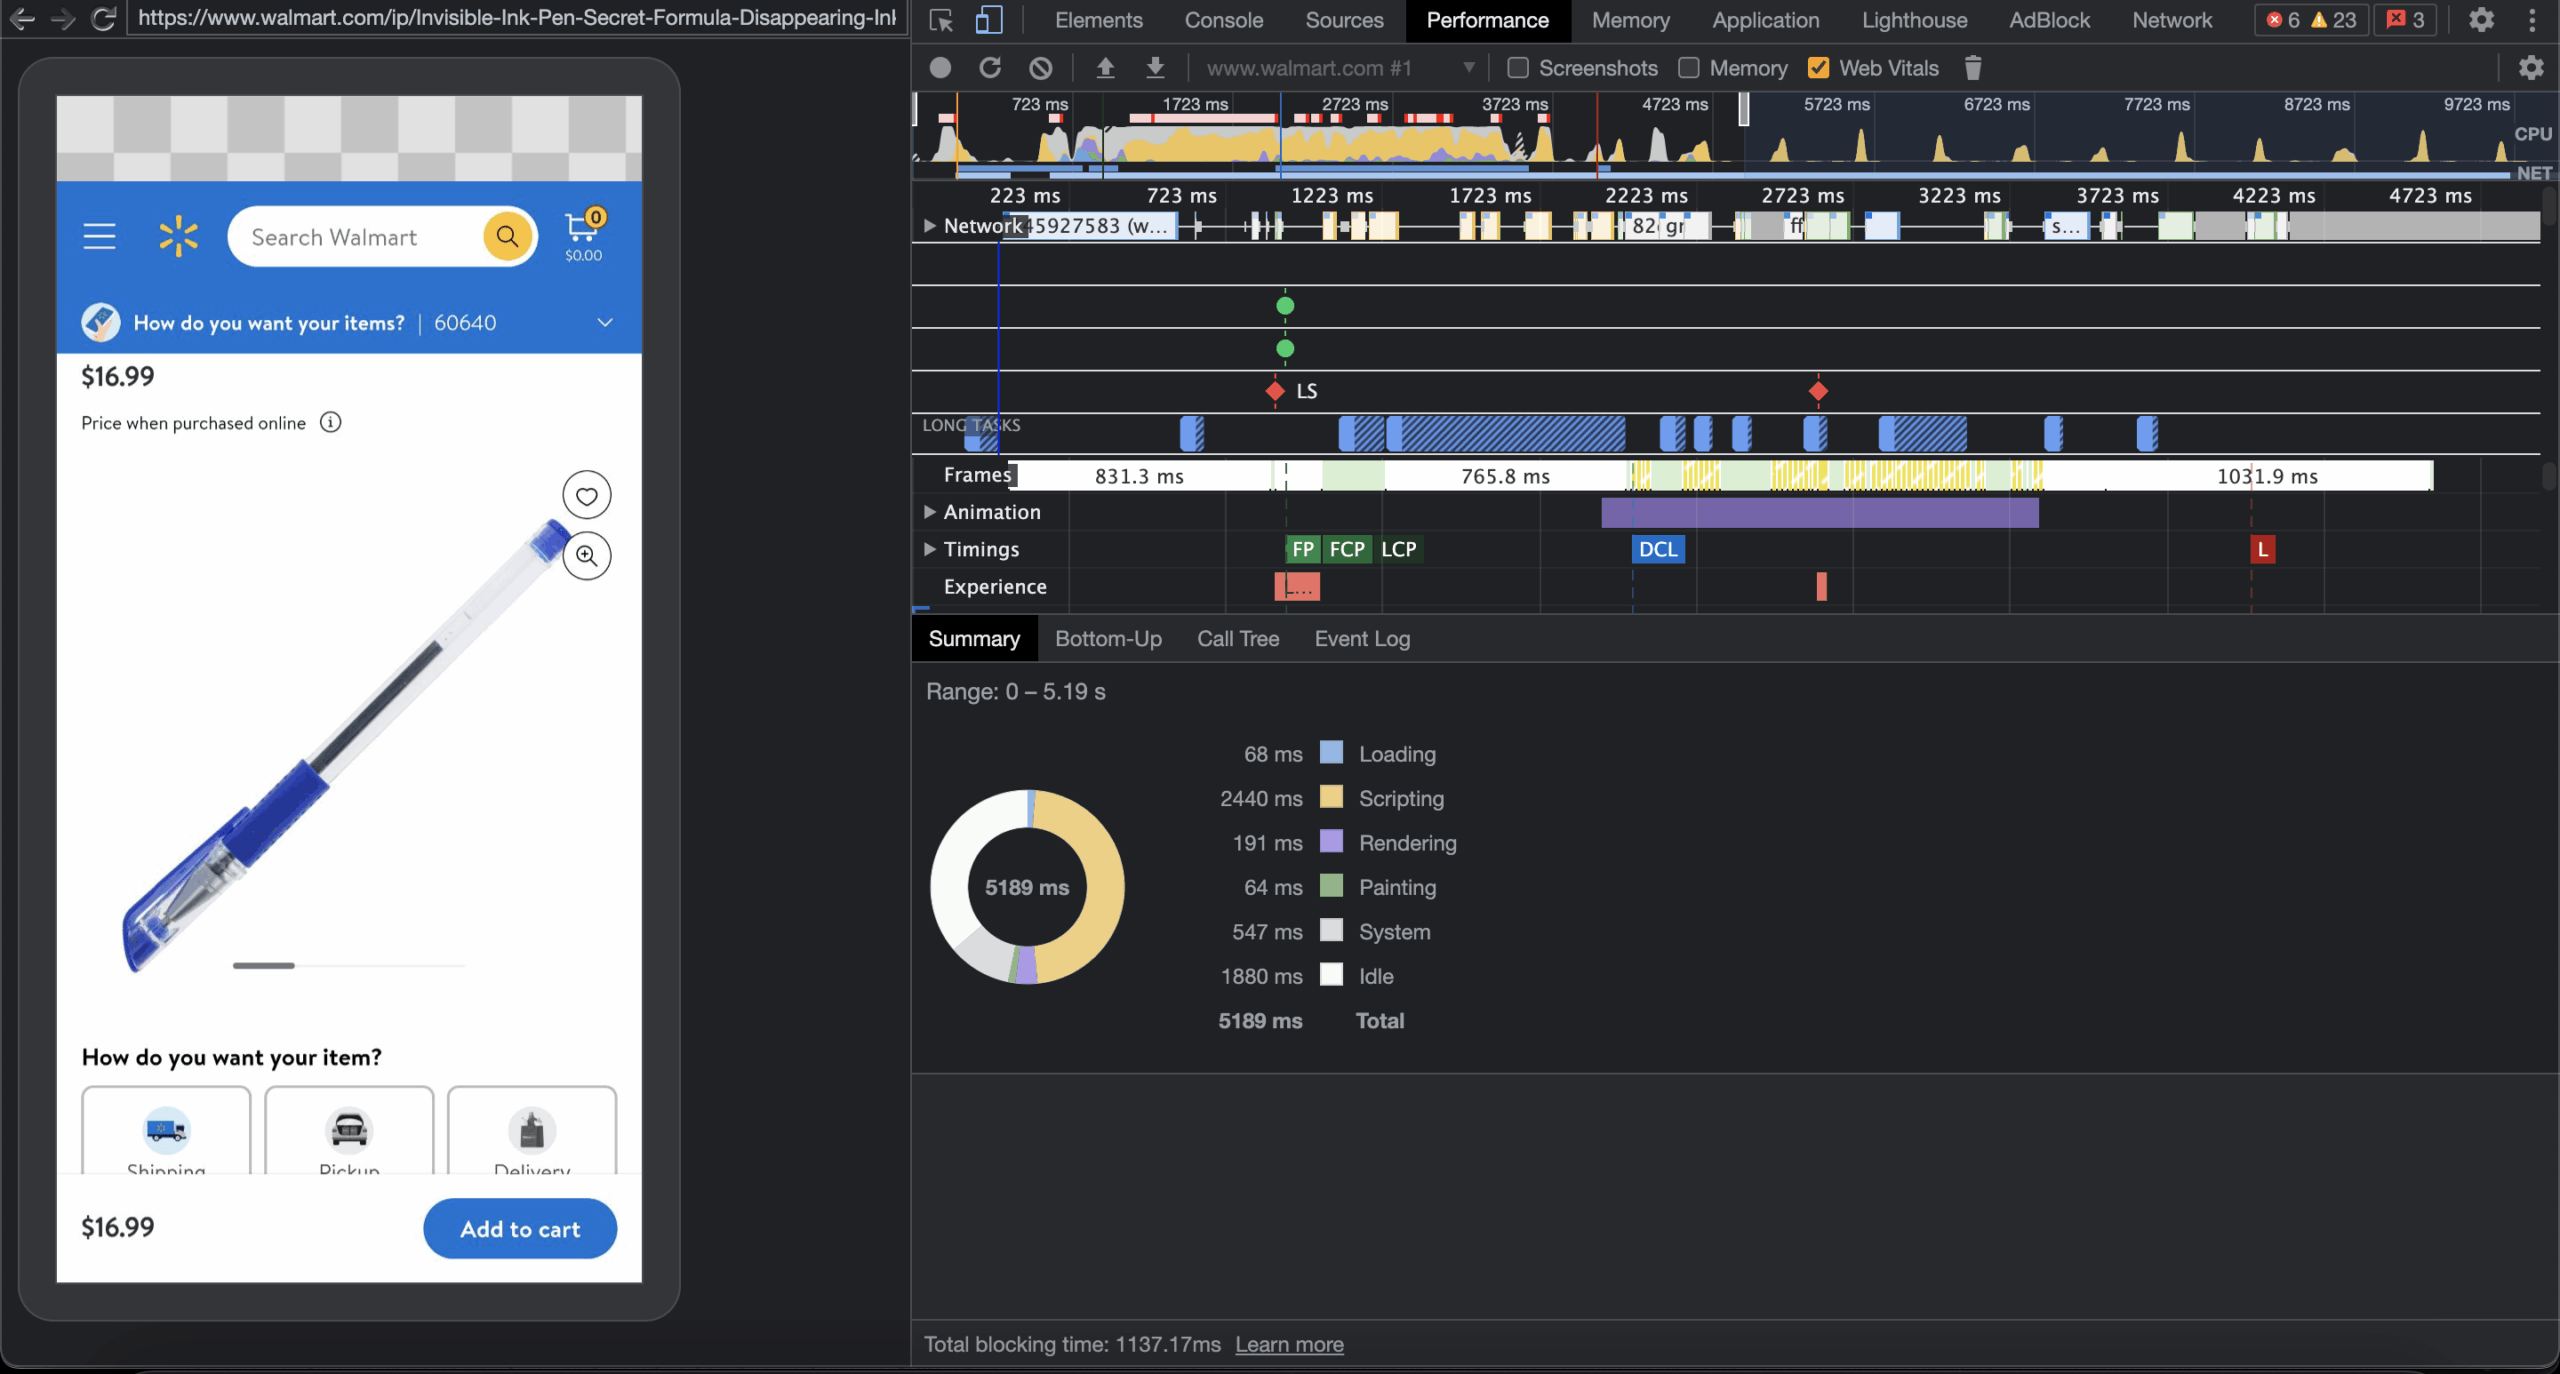
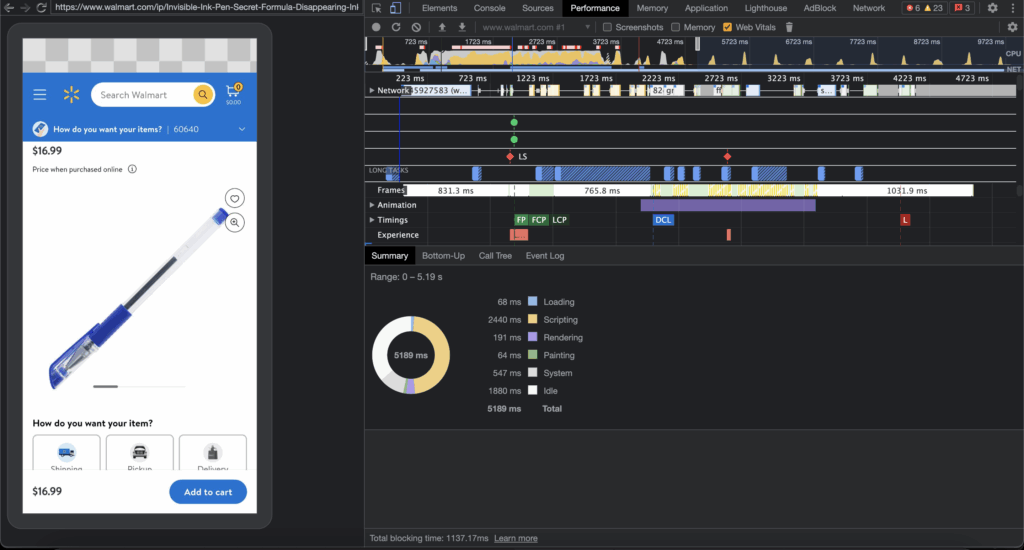
The Performance panel allows you to:
- Record performance profiles: Record a performance profile of your website while it’s running, which captures information about CPU usage, memory usage, and network activity.
- Analyze performance profiles: Analyze the performance profile to identify areas where your website is slow or inefficient.
- Identify performance bottlenecks: Identify specific functions or code blocks that are causing performance problems.
- Optimize performance: Use the insights from the performance profile to optimize your code and improve your website’s performance.
Specifically, look for long-running tasks, excessive garbage collection, and inefficient JavaScript code. Optimizing images and reducing network requests are also crucial for improving mobile performance. Using mobile dev tools effectively means understanding how your site behaves under stress.
Auditing Your Website for Mobile Performance
Chrome DevTools also includes an Audits panel, which provides automated audits of your website’s performance, accessibility, and best practices. The Audits panel uses Lighthouse, an open-source, automated tool for improving the quality of web pages.
The Audits panel can help you identify:
- Performance issues: Identify performance bottlenecks and get recommendations for improving your website’s speed.
- Accessibility issues: Identify accessibility problems and get recommendations for making your website more accessible to users with disabilities.
- SEO issues: Identify SEO problems and get recommendations for improving your website’s search engine ranking.
- Best practices: Identify violations of web development best practices and get recommendations for fixing them.
Running audits regularly is essential for maintaining a high-quality mobile experience. The mobile dev tools available in Chrome make this process straightforward.
Remote Debugging on Real Mobile Devices
While Device Mode is a valuable tool for emulating mobile devices, it’s important to test your website on real mobile devices to ensure that it works correctly in a real-world environment. Chrome DevTools allows you to remotely debug your website on real mobile devices using USB debugging.
To remotely debug your website on a real mobile device:
- Enable USB debugging on your mobile device: This typically involves enabling Developer Options in your device’s settings and then enabling USB debugging.
- Connect your mobile device to your computer via USB: Make sure your device is recognized by your computer.
- Open Chrome DevTools on your computer: Navigate to `chrome://inspect/#devices` in your Chrome browser.
- Find your mobile device in the list of devices: If your device is properly connected and USB debugging is enabled, it should appear in the list.
- Click “Inspect” next to your website’s tab: This will open a new DevTools window that is connected to your website running on your mobile device.
With remote debugging, you can inspect and debug your website in real-time on a real mobile device, giving you a more accurate understanding of how it performs.
Advanced Mobile Development Techniques with Chrome DevTools
Beyond the basic features, Chrome DevTools offers several advanced techniques for optimizing mobile development.
Using Lighthouse for Progressive Web App (PWA) Audits
Progressive Web Apps (PWAs) are web applications that provide a native app-like experience on mobile devices. Lighthouse can be used to audit your website’s PWA features, such as service workers, manifest files, and HTTPS support.
By running a PWA audit, you can identify areas where your website can be improved to provide a better PWA experience.
Analyzing Network Requests with the Network Panel
The Network panel in Chrome DevTools allows you to analyze all of the network requests that your website makes. This can be helpful for identifying slow-loading resources or unnecessary requests that are slowing down your website.
You can use the Network panel to:
- See the timing of each request: Identify requests that are taking a long time to load.
- See the size of each request: Identify large resources that are slowing down your website.
- Filter requests by type: Filter requests by type, such as images, scripts, or CSS files.
- Block requests: Block specific requests to see how your website behaves when those resources are not available.
Leveraging the Application Panel for Storage and Caching
The Application panel in Chrome DevTools provides tools for inspecting and managing your website’s storage and caching mechanisms. This can be helpful for optimizing your website’s performance and ensuring that it works correctly offline.
You can use the Application panel to:
- Inspect local storage and session storage: See the data that your website is storing in local storage and session storage.
- Inspect cookies: See the cookies that your website is using.
- Inspect the cache storage: See the resources that your website is caching.
- Simulate offline mode: Test how your website behaves when it’s offline.
Best Practices for Mobile Development with Chrome DevTools
To get the most out of Chrome DevTools for mobile development, follow these best practices:
- Test on real devices: Always test your website on real mobile devices to ensure that it works correctly in a real-world environment.
- Use Device Mode for quick testing: Use Device Mode for quick testing and debugging, but don’t rely on it exclusively.
- Profile your website’s performance: Regularly profile your website’s performance to identify bottlenecks and optimize your code.
- Run audits regularly: Run audits regularly to identify performance, accessibility, and SEO issues.
- Stay up-to-date with the latest DevTools features: Chrome DevTools is constantly evolving, so stay up-to-date with the latest features and improvements.
Conclusion
Chrome DevTools is an indispensable tool for mobile dev tools. By mastering the features and techniques described in this guide, you can significantly improve the performance, accessibility, and user experience of your mobile websites and web applications. Embracing a mobile-first approach and leveraging the power of Chrome DevTools will enable you to create exceptional mobile experiences that delight your users and drive business success. The ability to effectively utilize mobile dev tools is a core skill for any modern web developer. [See also: Optimizing Website Performance for Mobile Devices] [See also: Accessibility Testing for Web Applications] [See also: Debugging JavaScript Errors in Chrome]
