Unlocking Mobile Web Mastery: A Deep Dive into Chrome Mobile Developer Tools
In today’s mobile-first world, ensuring your website delivers a seamless and optimized experience on mobile devices is paramount. Fortunately, Chrome Mobile Developer Tools provide a robust suite of features to inspect, debug, and optimize your website directly on your mobile device or through emulation on your desktop. This comprehensive guide will explore the power of Chrome Mobile Developer Tools, enabling you to build better mobile web experiences.
The ability to effectively use Chrome Mobile Developer Tools is no longer a ‘nice to have’ skill, it’s a necessity for web developers. These tools allow you to simulate different devices, network conditions, and even geolocation, providing a holistic view of how your website performs under various circumstances. This article is designed to provide you with a comprehensive understanding of how to use these tools to their fullest potential, improving your website’s performance, accessibility, and overall user experience on mobile.
Why Use Chrome Mobile Developer Tools?
Before diving into the specifics, let’s understand why Chrome Mobile Developer Tools are indispensable for modern web development:
- Responsive Design Testing: Ensure your website adapts flawlessly to various screen sizes and orientations. Chrome Mobile Developer Tools allow precise control over device emulation, enabling accurate testing.
- Performance Optimization: Identify and address performance bottlenecks, such as slow-loading images, inefficient JavaScript, and excessive network requests. Mobile users demand speed, and these tools help you deliver it.
- Remote Debugging: Debug your website directly on a physical mobile device, gaining real-world insights into performance and behavior. This is crucial for identifying device-specific issues.
- Network Throttling: Simulate different network conditions (e.g., 3G, slow Wi-Fi) to understand how your website performs under less-than-ideal circumstances. This is especially important for users in areas with poor connectivity.
- Geolocation Overrides: Test location-based features without physically traveling to different locations. This is invaluable for developing and testing location-aware applications.
- Accessibility Audits: Ensure your website is accessible to users with disabilities by identifying and addressing accessibility issues.
Accessing Chrome Mobile Developer Tools
There are two primary ways to access Chrome Mobile Developer Tools:
Device Mode (Emulation)
Device Mode allows you to emulate different mobile devices directly within your Chrome browser on your desktop. This is a quick and convenient way to test your website’s responsiveness and basic functionality.
- Open Chrome DevTools: Press `F12` or right-click on your webpage and select “Inspect”.
- Toggle Device Mode: Click the “Toggle device toolbar” icon (looks like a phone and tablet).
- Select a Device: Choose a device from the dropdown menu (e.g., iPhone X, Samsung Galaxy S9).
- Customize Settings: Adjust screen size, orientation, and network throttling as needed.
Device Mode provides a powerful way to simulate different mobile environments without requiring physical devices. You can rotate the screen, simulate touch events, and even throttle the CPU to mimic the performance of lower-end devices.
Remote Debugging (Physical Device)
Remote debugging allows you to connect your Chrome browser on your desktop to a Chrome browser running on your Android device. This provides a more accurate representation of your website’s performance and behavior on a real device.
- Enable USB Debugging on Your Android Device: Go to Settings > Developer Options and enable USB debugging. (If you don’t see Developer Options, go to About Phone and tap the Build number seven times.)
- Connect Your Android Device to Your Computer: Use a USB cable to connect your device to your computer.
- Open Chrome on Your Desktop: Navigate to `chrome://inspect/#devices`.
- Configure Port Forwarding (If Necessary): If your device is not automatically detected, you may need to configure port forwarding in Chrome DevTools.
- Inspect Your Device: Once your device is detected, you’ll see a list of open tabs. Click “Inspect” to open DevTools for that tab.
Remote debugging provides the most accurate representation of your website’s performance on a real device. You can use it to inspect the DOM, debug JavaScript, and analyze network traffic in real-time.
Key Features of Chrome Mobile Developer Tools
Chrome Mobile Developer Tools offer a wide range of features to help you optimize your website for mobile devices. Here are some of the most important:
Elements Panel
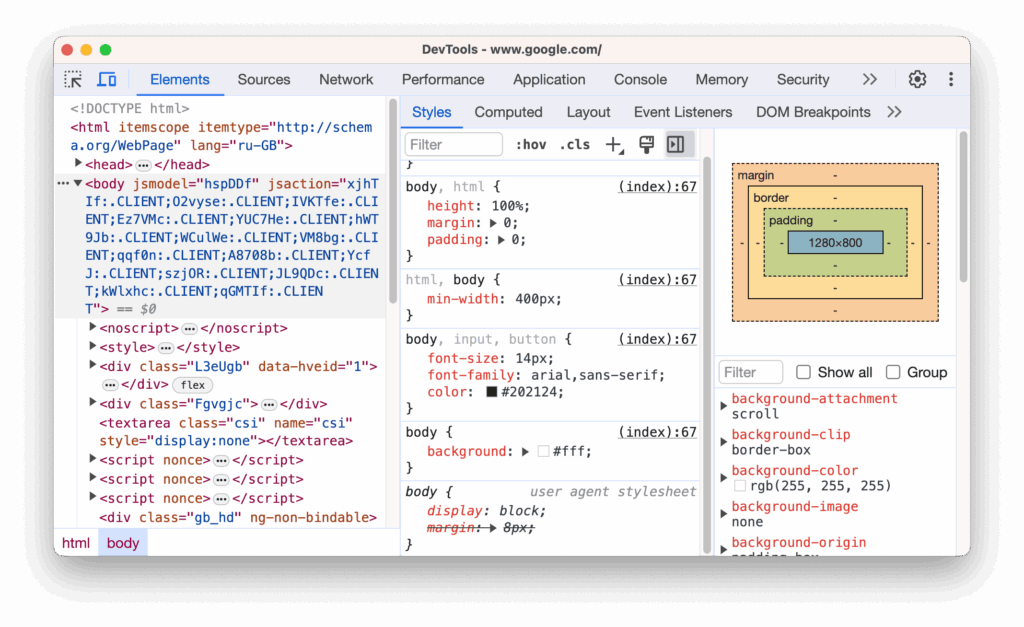
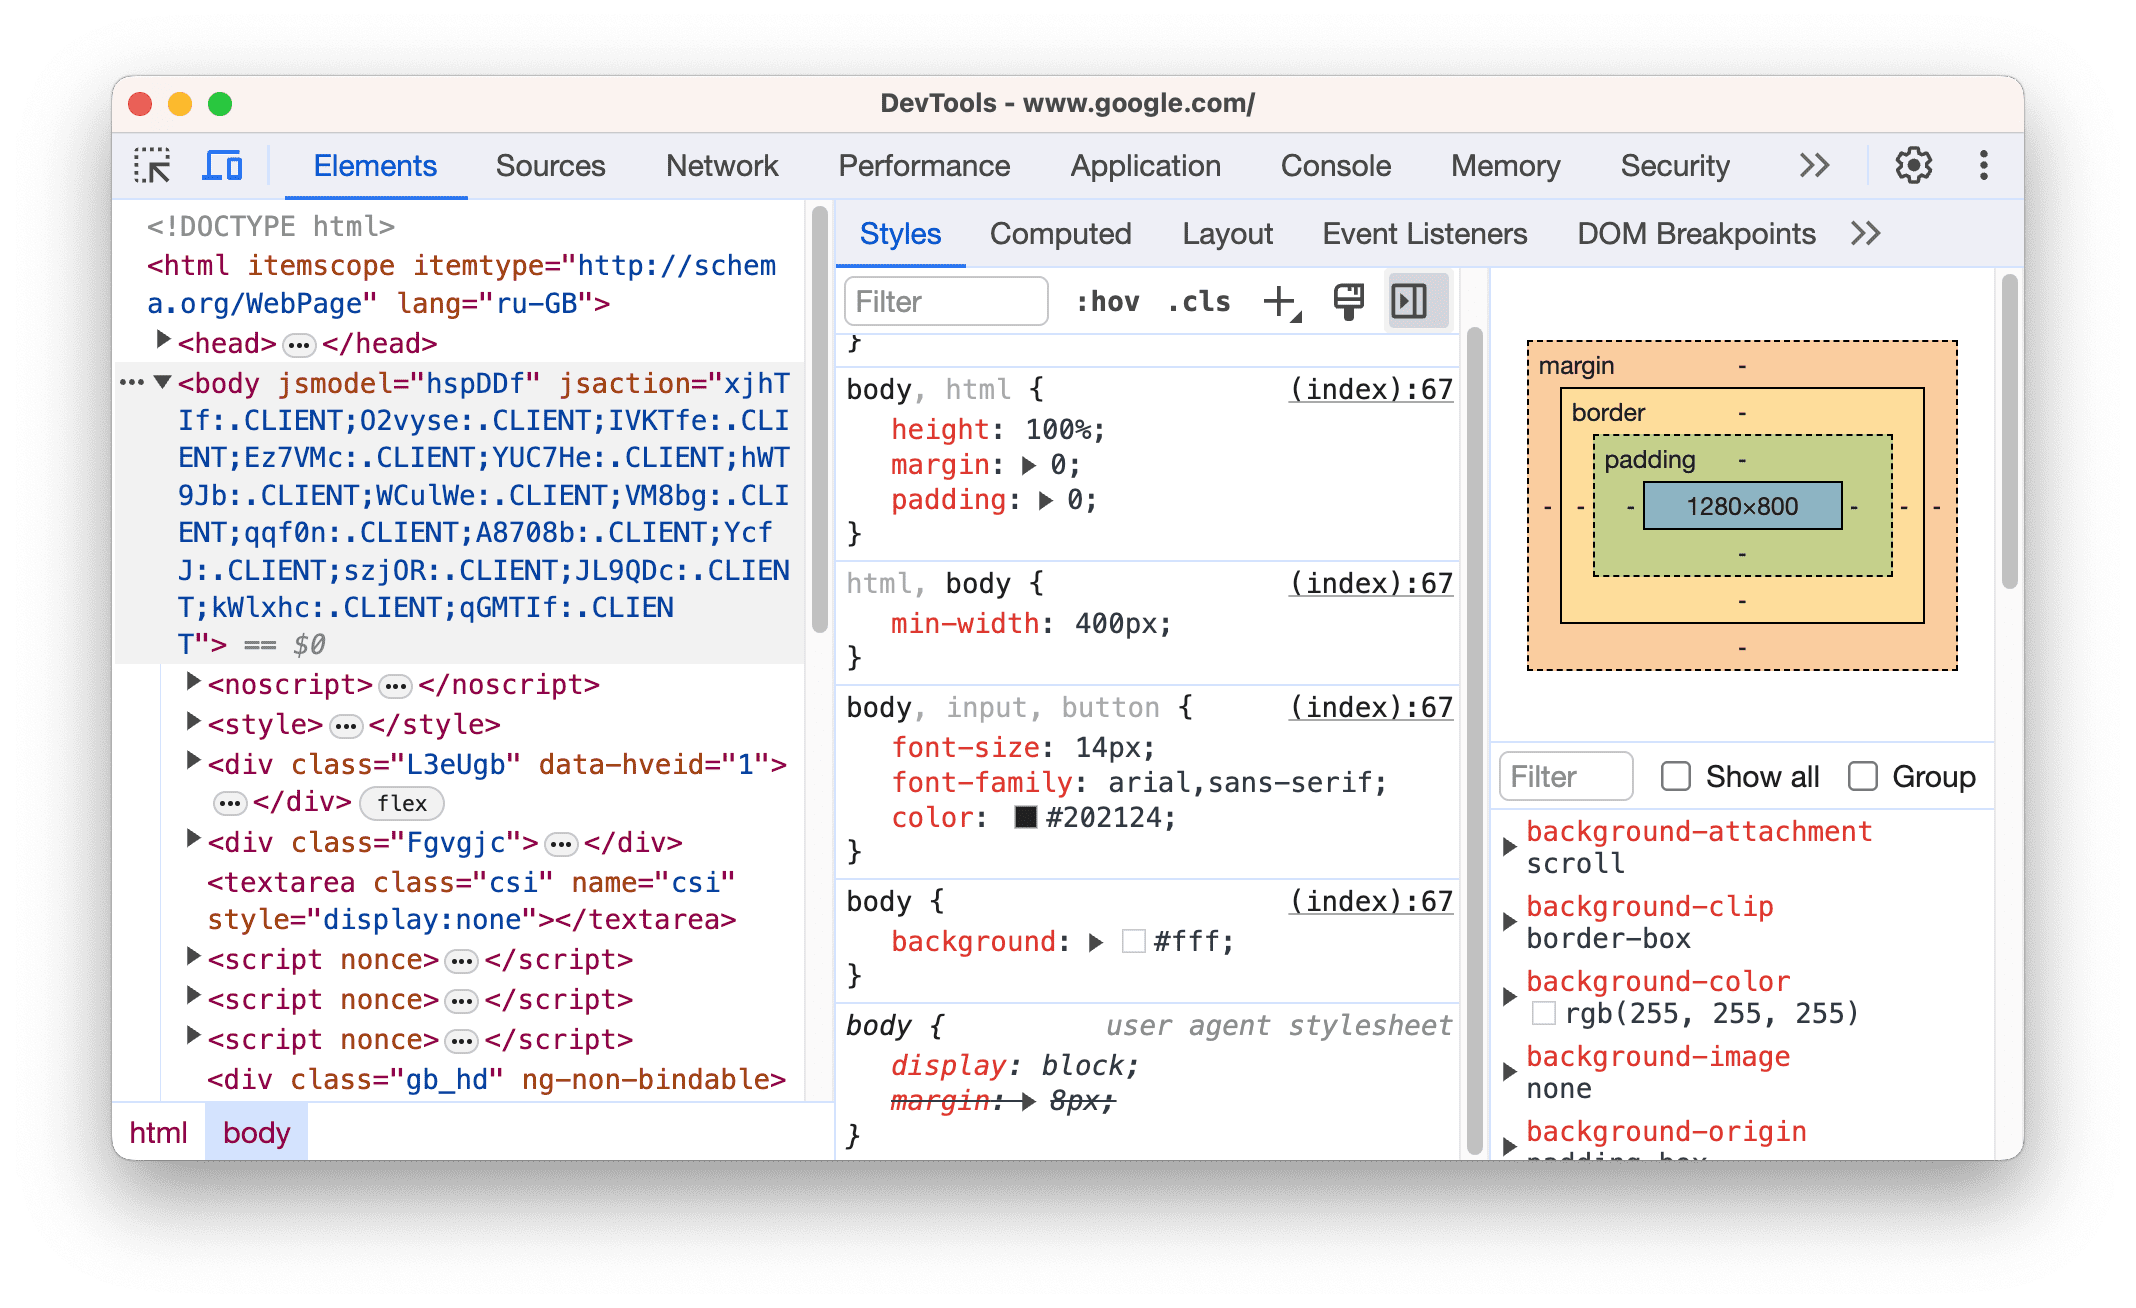
The Elements panel allows you to inspect and modify the HTML and CSS of your website in real-time. This is invaluable for debugging layout issues and experimenting with different styles.
- Inspect Elements: Hover over elements in the Elements panel to highlight them on the page.
- Edit HTML: Double-click on an element to edit its HTML content.
- Edit CSS: Modify CSS rules directly in the Styles pane.
- Computed Styles: View the computed styles for an element, showing the final values applied after cascading and inheritance.
Console Panel
The Console panel allows you to log messages, execute JavaScript code, and inspect JavaScript objects. This is essential for debugging JavaScript errors and testing new code snippets.
- Log Messages: Use `console.log()`, `console.warn()`, and `console.error()` to log messages to the console.
- Execute JavaScript: Type JavaScript code directly into the console and press Enter to execute it.
- Inspect Objects: Use `console.dir()` to inspect the properties of a JavaScript object.
- Filter Messages: Filter console messages by type (e.g., errors, warnings, logs).
Network Panel
The Network panel allows you to monitor the network requests made by your website. This is crucial for identifying slow-loading resources and optimizing your website’s performance.
- View Network Requests: See a list of all network requests, including their status, size, and duration.
- Filter Requests: Filter requests by type (e.g., images, scripts, stylesheets).
- Throttle Network: Simulate different network conditions to test your website’s performance under various circumstances.
- Analyze Waterfall Diagram: View a waterfall diagram showing the timing of each network request.
Performance Panel
The Performance panel allows you to record and analyze the performance of your website. This is invaluable for identifying performance bottlenecks and optimizing your website’s speed.
- Record Performance: Start a performance recording to capture the activity of your website.
- Analyze Flame Chart: View a flame chart showing the time spent in each function.
- Identify Bottlenecks: Identify performance bottlenecks, such as slow-loading scripts and inefficient rendering.
- Optimize Code: Use the performance data to optimize your code and improve your website’s speed.
Application Panel
The Application panel allows you to inspect and manage your website’s storage, including cookies, local storage, and session storage. This is useful for debugging storage-related issues and managing user data.
- Inspect Storage: View the contents of cookies, local storage, and session storage.
- Edit Storage: Modify the values of storage items directly in the Application panel.
- Clear Storage: Clear all storage for your website.
- Inspect Service Workers: Debug and manage service workers.
Audits Panel
The Audits panel (now part of Lighthouse) allows you to run audits on your website to identify performance, accessibility, and SEO issues. This is a great way to get a quick overview of your website’s strengths and weaknesses.
- Run Audits: Run audits for performance, accessibility, SEO, and best practices.
- View Results: View the results of the audits, including a score and recommendations for improvement.
- Prioritize Issues: Prioritize issues based on their impact and difficulty to fix.
- Improve Your Website: Use the audit results to improve your website’s performance, accessibility, and SEO.
Advanced Techniques with Chrome Mobile Developer Tools
Once you’re comfortable with the basics, you can explore some advanced techniques to further enhance your mobile web development workflow:
Simulating Different Geolocation
The Sensors tab in DevTools allows you to override the device’s geolocation. This is useful for testing location-based features without physically traveling to different locations. You can simulate specific coordinates or choose from predefined locations.
Overriding User Agent
The Network conditions tab allows you to override the user agent string. This is useful for testing how your website behaves with different browsers and devices. You can select from predefined user agent strings or enter your own custom string.
Debugging Web Workers
Web workers allow you to run JavaScript code in the background, without blocking the main thread. DevTools allows you to debug web workers by inspecting their console output and setting breakpoints in their code.
Analyzing Memory Leaks
Memory leaks can cause your website to slow down over time. DevTools provides tools to analyze memory usage and identify memory leaks. You can use the Memory panel to take heap snapshots and compare them to identify objects that are not being garbage collected.
Best Practices for Mobile Web Development
Using Chrome Mobile Developer Tools effectively is only part of the equation. Here are some best practices to keep in mind when developing for mobile:
- Prioritize Mobile-First Design: Design your website for mobile devices first, then progressively enhance it for larger screens.
- Optimize Images: Use optimized images that are appropriately sized for mobile devices.
- Minimize HTTP Requests: Reduce the number of HTTP requests by combining files and using CSS sprites.
- Use a Content Delivery Network (CDN): Use a CDN to deliver your website’s assets from servers that are geographically close to your users.
- Cache Assets: Use browser caching to store assets locally, reducing the need to download them repeatedly.
- Test on Real Devices: While emulation is useful, always test your website on real devices to ensure it performs well in the real world.
Conclusion
Chrome Mobile Developer Tools are an indispensable asset for any web developer focused on delivering exceptional mobile experiences. By mastering these tools, you can effectively diagnose and resolve performance bottlenecks, optimize responsiveness, and ensure accessibility across a wide range of mobile devices. Embrace the power of Chrome Mobile Developer Tools to unlock the full potential of your mobile web development projects and create websites that delight users on any screen.
From responsive design testing to performance optimization and remote debugging, Chrome Mobile Developer Tools offer a comprehensive suite of features to help you build better mobile web experiences. By following the best practices outlined in this guide, you can create websites that are fast, responsive, and accessible to all users. So, dive in, experiment, and unlock the power of Chrome Mobile Developer Tools to elevate your mobile web development skills.
[See also: Optimizing Website Performance for Mobile Devices]
[See also: A Comprehensive Guide to Responsive Web Design]
[See also: Mobile First Indexing: What You Need to Know]

